Storing observability data at scale has a dirty secret: the bottleneck is almost never the query engine. It’s disk. Managed Kafka clusters with large retention, ClickHouse nodes with terabytes of attached storage, replication across disks that cost a fortune — all to handle data that’s written constantly but read rarely.
This setup flips that. Everything ends up on S3. Not as a backup. As the primary storage.
- AutoMQ handles the Kafka API but stores all message data on S3
- ClickHouse stores all telemetry tables on S3 via a storage policy
- OpenTelemetry Collector connects them, fully stateless
The full configuration is at github.com/gabszs/oteland/tree/master/k8s
Table of contents
Open Table of contents
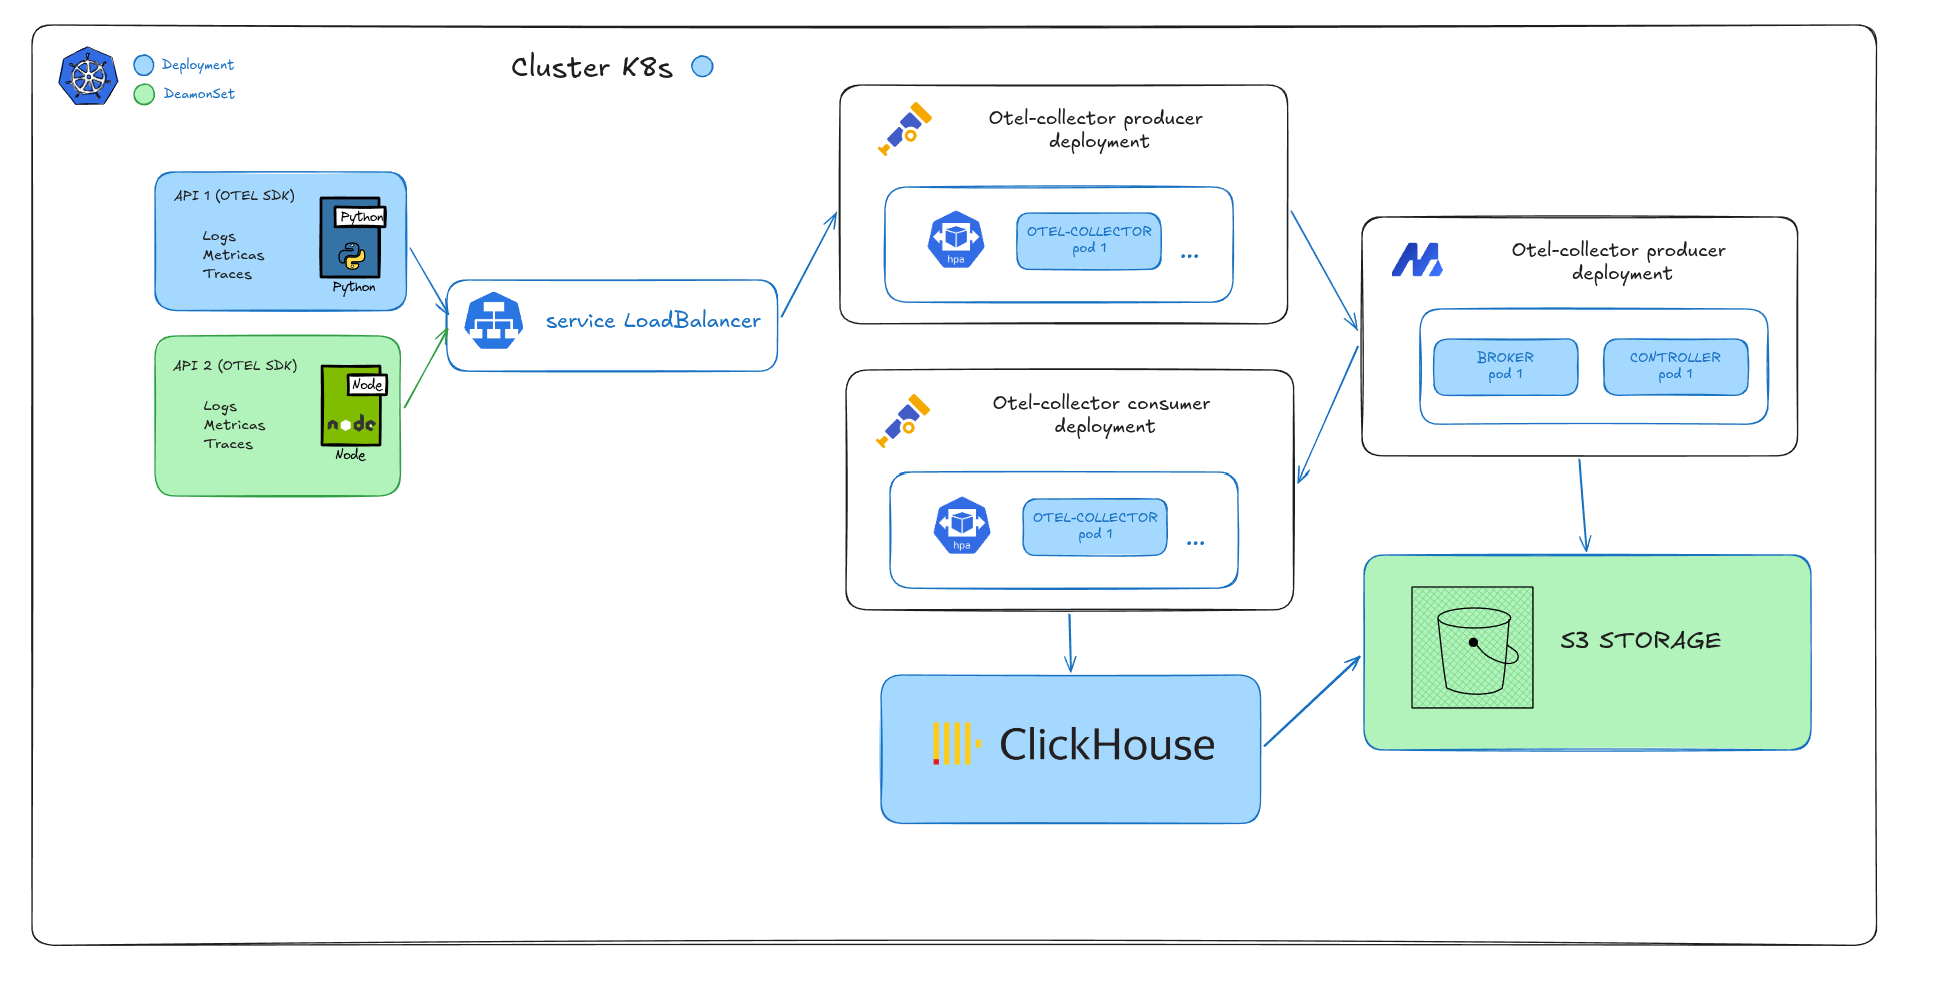
The pipeline
Apps (any language, any SDK)
        │
        ▼  OTLP gRPC/HTTP
 otel-collector/producer     ← LoadBalancer: :4317 / :4318
        │
        ▼  3 Kafka topics (SASL + zstd)
      AutoMQ                 ← S3-backed broker (no broker disk for durability)
        │
        ▼
 otel-collector/consumer     ← autoscales 1 → 10 pods
        │
        ▼
    ClickHouse               ← 2 shards × 2 replicas, S3 storage policy
Three signals, one path. Logs, traces and metrics flow through the same pipeline — separate Kafka topics (otel-logs, otel-traces, otel-metrics), same consumer, same ClickHouse cluster.
The backend here is ClickHouse, but the Kafka layer is backend-agnostic. You could swap the consumer’s exporter for Grafana LGTM (Loki, Tempo, Mimir), Datadog, Elasticsearch, or any OTLP-compatible destination without touching the producers or the broker. The collector is just a pipe.
AutoMQ: Kafka without the disk problem
Kafka’s durability model is built on disk: brokers replicate data across multiple nodes to survive failures. That’s fine, but it means you pay for disk in every broker, in every replica, all the time.
AutoMQ keeps the Kafka API exactly as-is — producers and consumers don’t know the difference — but replaces the storage layer with S3. Message data goes to S3 immediately. Brokers become stateless. The disk on each node is just a WAL cache: a write buffer before the flush to S3.
The practical result:
- No broker replication — S3 handles durability
- Brokers can restart freely — state lives in S3, not on the node
- Storage cost drops — S3 is roughly 10x cheaper than SSD per GB
- Retention becomes trivial — store 90 days for the cost of a few dollars
The trade-off is latency. Writing to S3 adds a few milliseconds versus local disk. For observability pipelines — where producers are non-blocking and you’d happily accept 50ms — this is a very good deal.
Stack
| Component | Role |
|---|---|
| OTel Collector contrib | Receives OTLP → Kafka; Kafka → ClickHouse |
| AutoMQ | Kafka-compatible broker, all data on S3 |
| ClickHouse | Columnar store for all OTLP signals, also on S3 |
| Garage / MinIO / S3 | Primary storage for both Kafka and ClickHouse |
| ClickHouse Keeper | ZooKeeper replacement for ClickHouse coordination |
Deploying AutoMQ
AutoMQ ships a Docker image compatible with the Bitnami Kafka Helm chart. You swap the image, add the S3 config in extraConfig, and it works:
helm install automq-release oci://registry-1.docker.io/bitnamicharts/kafka \
  -f values.yaml \
  --version 31.5.0 \
  --namespace automq \
  --create-namespace
The critical parts of values.yaml:
image:
  repository: automqinc/automq
  tag: 1.5.0-bitnami

extraEnvVars:
  - name: AWS_ACCESS_KEY_ID
    value: "<your-s3-access-key>"
  - name: AWS_SECRET_ACCESS_KEY
    value: "<your-s3-secret-key>"
And in extraConfig (same block for both controller and broker):
elasticstream.enable=true

# WAL: batches writes before flushing to S3 — must stay inside MaxDirectMemorySize
s3.wal.cache.size=1073741824       # 1 GB
s3.block.cache.size=536870912      # 512 MB — caches reads from S3
s3.stream.allocator.policy=POOLED_DIRECT

# Two buckets: one for cluster metadata, one for message data
s3.ops.buckets=1@s3://automq-ops?region=garage&endpoint=http://<s3-host>:3900&pathStyle=true
s3.data.buckets=0@s3://automq-data?region=garage&endpoint=http://<s3-host>:3900&pathStyle=true
s3.wal.path=0@s3://automq-data?region=garage&endpoint=http://<s3-host>:3900&pathStyle=true

# AutoMQ pushes its own JVM, S3, and stream metrics via OTLP — no jmx_exporter needed
s3.telemetry.metrics.exporter.uri=otlp://?endpoint=http://<otel-producer>:4317&protocol=grpc
AutoMQ uses two S3 buckets with distinct responsibilities:
| Bucket | Contents |
|---|---|
automq-ops | Cluster metadata, consumer group offsets |
automq-data | Message WAL and stream data |
Memory:
s3.wal.cache.size+s3.block.cache.sizecount against-XX:MaxDirectMemorySize. Set them within the limit or you’ll hit OOM with no helpful error message.
Getting S3 credentials
Garage:
garage key create automq-key
garage key info automq-key  # prints Access Key ID and Secret
MinIO:
mc admin user svcacct add myminio automq-userAWS S3: create an IAM user with s3:GetObject, s3:PutObject, s3:DeleteObject and s3:ListBucket on both buckets.
Getting Kafka credentials
The Bitnami chart generates SASL credentials and stores them in a Kubernetes Secret:
kubectl get secret automq-kafka-user-passwords -n automq \
  -o jsonpath='{.data}' | \
  python3 -c "import sys,json,base64; d=json.load(sys.stdin); [print(k+':', base64.b64decode(v).decode()) for k,v in d.items()]"
The client-passwords key is what external clients use — with username user1.
SASL gotcha: The chart provisions users via SCRAM, not PLAIN. Connecting with
mechanism: PLAINgives youUnexpected Kafka request of type METADATA during SASL handshake. UseSCRAM-SHA-256in every client config, no exceptions.
OpenTelemetry Collector: two deployments
The collector is split into two deployments with very different resource profiles.
Producer — receives OTLP, writes to Kafka:
resources:
  requests:
    cpu: 100m
    memory: 256Mi
  limits:
    cpu: 500m
    memory: 512Mi

config:
  exporters:
    kafka:
      brokers:
        - automq-kafka.automq.svc.cluster.local:9092
      logs:
        topic: otel-logs
        encoding: otlp_json
      metrics:
        topic: otel-metrics
        encoding: otlp_json
      traces:
        topic: otel-traces
        encoding: otlp_json
      auth:
        sasl:
          username: user1
          password: "<kafka-password>"
          mechanism: SCRAM-SHA-256
      producer:
        compression: zstd    # meaningful savings on structured JSON payloads
        required_acks: 1     # broker confirms receipt, doesn't wait for S3 flush
Consumer — reads from Kafka, writes to ClickHouse:
resources:
  requests:
    cpu: 500m
    memory: 1Gi
  limits:
    cpu: "2"
    memory: 2Gi

autoscaling:
  enabled: true
  minReplicas: 1
  maxReplicas: 10
  targetCPUUtilizationPercentage: 65

config:
  processors:
    batch:
      timeout: 10s            # wait up to 10s to fill a batch
      send_batch_size: 5000   # or until 5k messages — matches ClickHouse insert patterns
  exporters:
    clickhouse:
      endpoint: tcp://clickhouse:9000
      json: true              # use JSON type for attribute columns
      create_schema: false    # we manage the schema ourselves
      connection_params:
        enable_json_type: "1"
Three topics, one consumer group. If the consumer lags (traffic burst, ClickHouse slow), the HPA adds pods and Kafka redistributes partitions across them automatically.
Self-scaling without manual intervention
When autoscaling.enabled: true, the Helm chart creates a Kubernetes HorizontalPodAutoscaler targeting the consumer Deployment. You don’t manage replicas — the cluster does.
The loop is simple:
- Traffic spikes → consumer CPU rises above 65%
- HPA detects it and increases the replica count
- New consumer pods join the same consumer group (
otel-kafka-consumer) - Kafka rebalances partitions across the new pods
- Throughput goes up, CPU drops, HPA stabilizes
Scale-down follows the same logic in reverse. When traffic drops, pods are removed and partitions are consolidated — all without touching any config.
The only thing you need to set is the right requests.cpu. HPA calculates utilization as current CPU / requests.cpu, so if requests is too low, the HPA thinks the pod is always at 100% and scales aggressively; too high, and it never scales. The 500m request with a 2 limit gives a comfortable range for the consumer’s workload at ~1k events/s.
# watch the HPA in action during a load test
kubectl get hpa -n observability -w
NAME REFERENCE TARGETS MINPODS MAXPODS REPLICAS
otel-consumer Deployment/otel-consumer 12%/65% 1 10 1
otel-consumer Deployment/otel-consumer 71%/65% 1 10 2
otel-consumer Deployment/otel-consumer 38%/65% 1 10 2Processors: more than just batching
The batch processor is the obvious one, but the resource processor is where the pipeline gets interesting.
In the consumer, you can tag every signal with where it’s coming from:
processors:
  resource/cluster_meta:
    attributes:
      - key: k8s.cluster.name
        value: prod-k3s
        action: insert
      - key: telemetry.pipeline
        value: kafka-consumer
        action: insert
This is useful when multiple environments share the same ClickHouse cluster — you can filter by k8s.cluster.name at query time without needing separate tables.
You can also use Kafka topics to route different signals to different pipelines. One topic per environment, one per team, or separate topics for high-volume signals that need their own consumer group:
exporters:
  kafka:
    logs:
      topic: otel-logs-team-a      # team A routes here
    traces:
      topic: otel-traces-prod
    metrics:
      topic: otel-metrics-prod
The consumer group handles the rest — add consumer pods for high-volume topics, keep low-volume ones sharing instances.
ClickHouse: the JSON schema
ClickHouse is where the data lands. Each signal type has its own table, but the OTLP attribute model (arbitrary key-value maps per span, log, metric) has always been awkward to represent in columns.
The older approach was Map(LowCardinality(String), String):
`ResourceAttributes` Map(LowCardinality(String), String) CODEC(ZSTD(1)),
`SpanAttributes`     Map(LowCardinality(String), String) CODEC(ZSTD(1)),
It works, the exporter supports it, and ClickHouse handles Map queries fine. But every attribute value becomes a string — type information from the SDK is lost.
The newer approach uses the experimental JSON type:
SET allow_experimental_json_type = 1;

CREATE TABLE IF NOT EXISTS default.otel_logs ON CLUSTER 'ch'
(
    `Timestamp`          DateTime64(9) CODEC(Delta(8), ZSTD(1)),
    `ServiceName`        LowCardinality(String) CODEC(ZSTD(1)),
    `Body`               String CODEC(ZSTD(1)),
    `ResourceAttributes` JSON CODEC(ZSTD(1)),   -- was Map(...), preserves types
    `LogAttributes`      JSON CODEC(ZSTD(1)),
    INDEX idx_body Body TYPE tokenbf_v1(32768, 3, 0) GRANULARITY 8
)
ENGINE = ReplicatedMergeTree('/clickhouse/tables/{shard}/otel_logs', '{replica}')
PARTITION BY toDate(Timestamp)
PRIMARY KEY (ServiceName, toDateTime(Timestamp))
ORDER BY (ServiceName, toDateTime(Timestamp), Timestamp)
SETTINGS storage_policy = 's3_main', index_granularity = 8192;
The otel-collector-contrib ClickHouse exporter supports JSON natively with json: true — you don’t change the pipeline config, just the schema and the enable_json_type connection param. The full schema (all 7 tables: logs, traces, 5 metric types, plus the trace ID lookup) is at github.com/gabszs/oteland/blob/master/k8s/clickhouse/schema/otel.sql.
The trace ID lookup table
One detail worth calling out: the traces schema creates a secondary table otel_traces_trace_id_ts plus a materialized view that maintains the start/end time for each trace:
CREATE MATERIALIZED VIEW IF NOT EXISTS default.otel_traces_trace_id_ts_mv ON CLUSTER 'ch'
TO default.otel_traces_trace_id_ts AS
SELECT
    TraceId,
    toDateTime(min(Timestamp)) AS Start,
    toDateTime(max(Timestamp)) AS End
FROM default.otel_traces
WHERE TraceId != ''
GROUP BY TraceId;
Without this, finding all spans for a trace requires scanning otel_traces without a time bound — which is expensive when the table is partitioned by date. With it, you look up the time window first (fast, bloom filter on TraceId), then scan only the relevant partition.
ClickHouse on S3
The cluster is managed by the Altinity operator: 2 shards × 2 replicas, with ClickHouse Keeper for coordination (no external ZooKeeper).
The S3 storage policy is declared in the ClickHouseInstallation spec:
settings:
  storage_configuration/disks/logging/type: s3
  storage_configuration/disks/logging/endpoint: http://<s3-host>:3900/clickhouse-bucket/{installation}/{replica}/
  storage_configuration/disks/logging/access_key_id: <your-access-key>
  storage_configuration/disks/logging/secret_access_key: <your-secret-key>
  storage_configuration/policies/s3_main/volumes/main/disk: logging
And every table is created with SETTINGS storage_policy = 's3_main'. ClickHouse still uses local disk for in-memory operations and part merges, but cold data lives on S3.
The practical effect: you can run small nodes and store months of telemetry without ever thinking about disk capacity.
S3 as the foundation
At this point the storage picture looks like this:
| Layer | Bucket | Contents |
|---|---|---|
| AutoMQ | automq-ops | Kafka metadata, consumer offsets |
| AutoMQ | automq-data | Message WAL, stream data |
| ClickHouse | clickhouse-k3s | Table parts, all OTLP signals |
No data lives on broker disk. No data lives on ClickHouse node disk beyond the hot tier during merges. If a node dies, it comes back, reconnects to S3, and continues — no peer replication needed.
The failure modes change too. Broker restart? Fast — no log recovery, just metadata from automq-ops. ClickHouse node replacement? Add a new replica, it pulls parts from S3. Storage full? That doesn’t happen: S3 scales infinitely, and you manage retention with a lifecycle rule.
Deploying ClickHouse
# Altinity operator
kubectl apply -f https://raw.githubusercontent.com/Altinity/clickhouse-operator/master/deploy/operator/clickhouse-operator-install-bundle.yaml

# ClickHouse cluster + Keeper
kubectl apply -f clickhouse/values.yaml

# Schema — run after the cluster is Ready
kubectl exec -n clickhouse clickhouse-clickhouse-0-0-0 -- \
  clickhouse-client -u admin_user --password <password> \
  --multiquery < clickhouse/schema/otel.sql
Admin credentials are stored in a Kubernetes Secret referenced by the ClickHouseInstallation:
kubectl create secret generic clickhouse-logging-creds \
  -n clickhouse \
  --from-literal=admin_password=<your-admin-password>
Testing the pipeline
Once everything is up, the fastest way to validate the full path — producer → Kafka → consumer → ClickHouse — is telemetrygen, the official load generator from the OTel contrib repo.
go install github.com/open-telemetry/opentelemetry-collector-contrib/cmd/telemetrygen@latestThen fire all three signal types in parallel:
telemetrygen logs \
  --otlp-endpoint 192.168.1.112:4318 --otlp-http --otlp-insecure \
  --duration 5m --rate 333 --service otel-kafka-loadtest-logs &

telemetrygen metrics \
  --otlp-endpoint 192.168.1.112:4318 --otlp-http --otlp-insecure \
  --duration 5m --rate 333 --service otel-kafka-loadtest-metrics &

telemetrygen traces \
  --otlp-endpoint 192.168.1.112:4318 --otlp-http --otlp-insecure \
  --duration 5m --rate 333 --service otel-kafka-loadtest-traces &
333 logs/s + 333 metrics/s + 333 traces/s = ~1000 events/s across all three signals. Run that for a month and you get:
1000 × 86,400 × 31 = 2,678,400,000 — over 2.6 BILLION events/month
That’s the title in practice. The pipeline handles it with the consumer autoscaling, Kafka absorbing bursts in S3, and ClickHouse batching inserts. The nodes stay small.
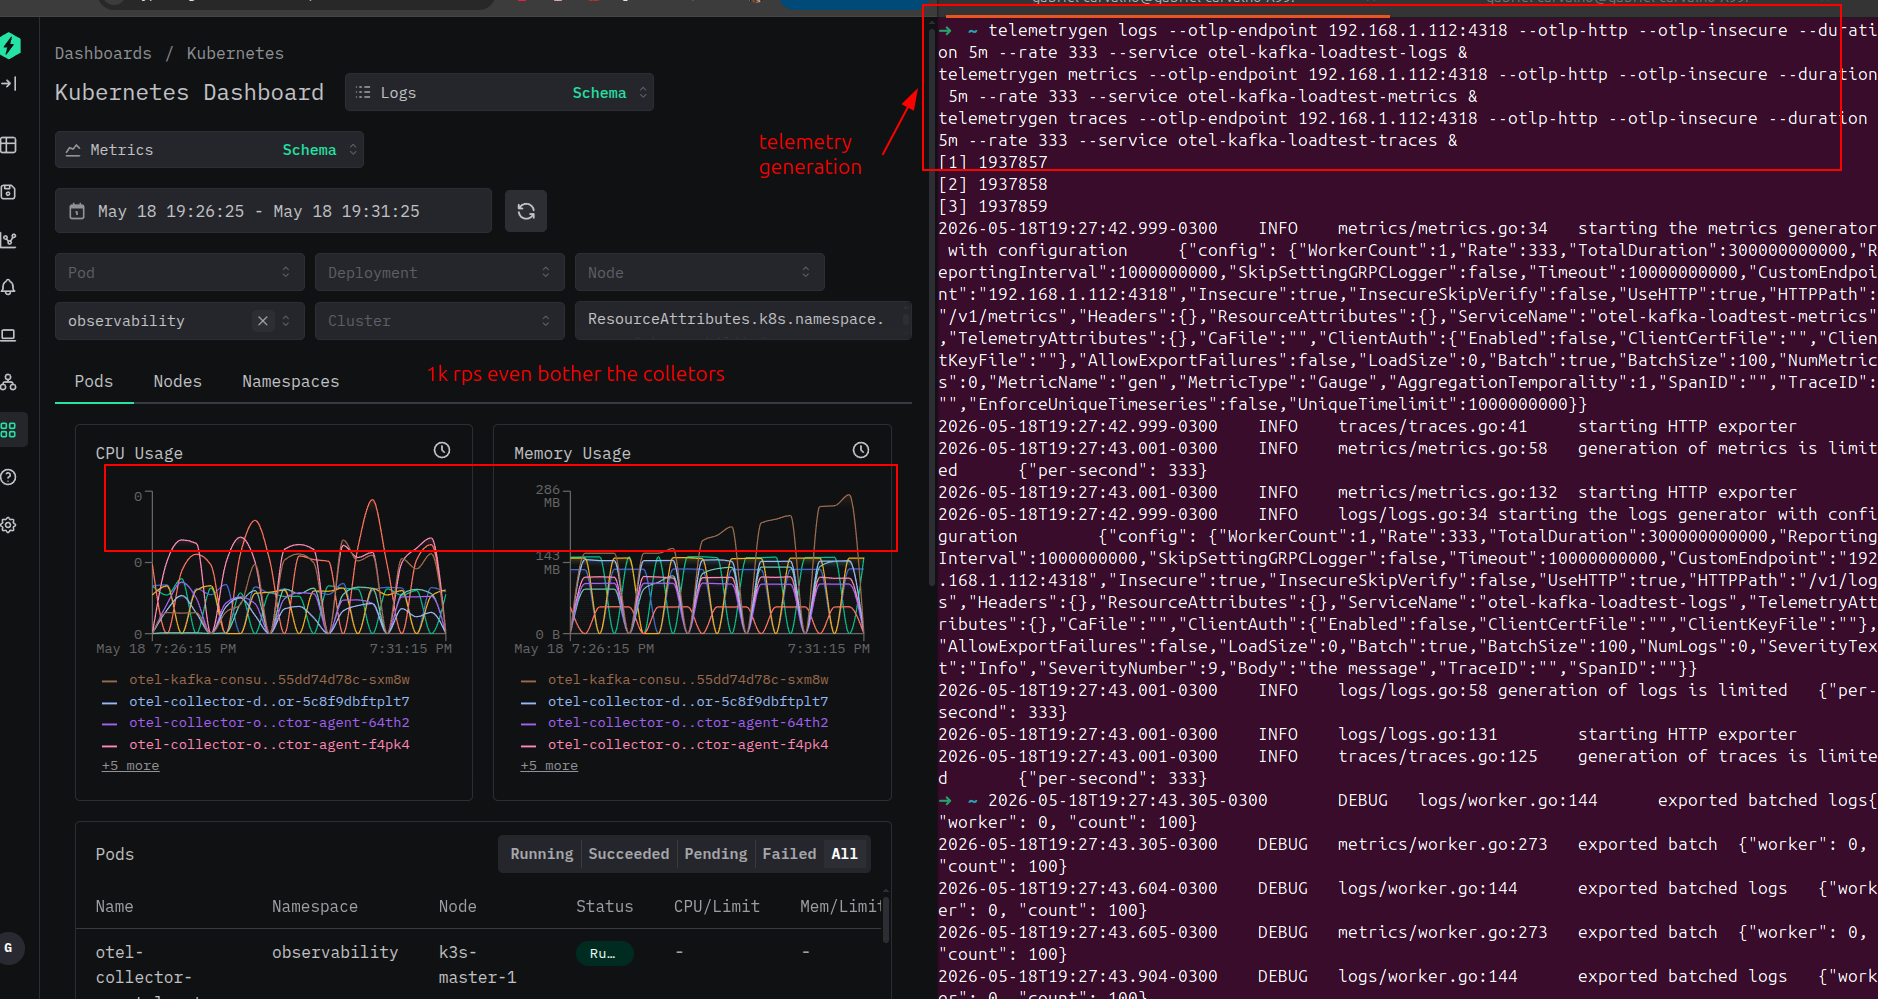 telemetrygen pushing 1k events/s — terminal output on the right, collector CPU/RAM on the left
After a few minutes, verify in ClickHouse:
SELECT count(), ServiceName
FROM default.otel_logs
WHERE Timestamp > now() - INTERVAL 10 MINUTE
GROUP BY ServiceName;
If you see otel-kafka-loadtest-logs in the results, the full pipeline is working.
Why this stack?
- Cheap retention — S3 at ~$0.023/GB vs $0.08–0.12/GB for SSD. Ninety days of traces without thinking about it.
- Stateless brokers — AutoMQ nodes restart, scale, or get replaced without data loss or partition rebalancing.
- Three signals, one pipeline — logs, traces and metrics share the same infrastructure. No separate cluster per signal type.
- ClickHouse scales independently — add shards for write throughput, add replicas for read concurrency. Storage doesn’t move.
- AutoMQ native telemetry — the broker pushes its own JVM, S3 and stream metrics via OTLP directly into the pipeline.
- Chainable collectors — the collector is designed to be put behind other collectors. Each team runs its own instance with its own config and routes to the central Kafka cluster. The Kafka + consumer layer handles storage at scale; individual teams only manage their own instrumentation. No team needs to think about where the data lands.
Links
- Full configuration (k8s/)
- ClickHouse OTLP schema
- AutoMQ docs
- OTel Collector contrib
- Altinity ClickHouse operator
- ClickHouse JSON type
If you liked this post, have any feedback or questions, you can reach me on WhatsApp or email.